
Background
Remember going to elementary school on your birthday and being so excited? Because today is your birthday, everyone is going to be part of ‘YOUR’ special day, what could go wrong? But then the strangest thing happens, you get to class and find out that it isn’t just your birthday, but in fact the birthday of the kid you sit right next to. Really?! Someone else shares the same birthday as you, even with 365 days of the year? Well, in today’s post we are going to uncover the probability of this occurring in any group size.
Explanation
The analysis of this problem will require us to tackle the issue from a different angle. Instead of focusing on the Probability of Sharing the same date, we are going to begin with the Probability of Not Sharing the same date. The reason we will want to do that is because of the following:
\[ \text{------------------------------------------------} \\\text{Prob(Sharing the Same Birthday) = 1 - Prob(NOT Sharing the Same Birthday)} \\\text{------------------------------------------------} \]
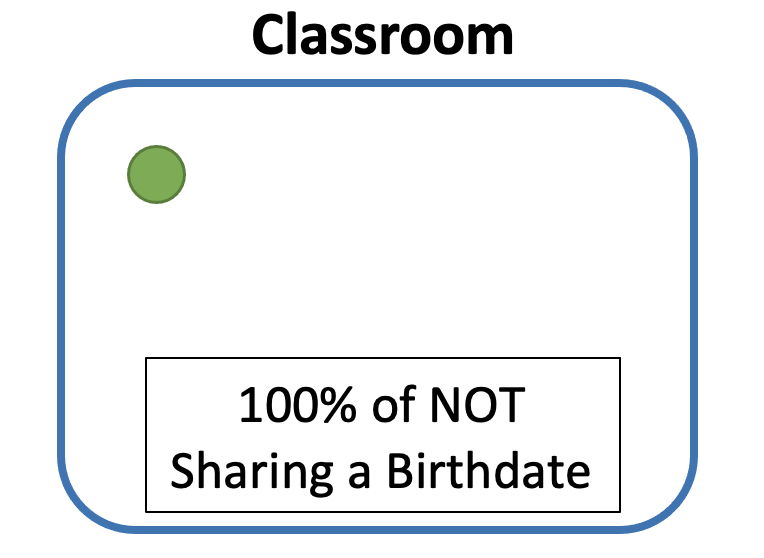
Let’s tackle this problem with an experiment by creating a classroom that is going to slowly fill up with students. As the first students comes into the room, the probability that they doesn’t share a birthday with any one in the room is 100%. This should make sense because there is no one else in the room, so of course there is a 100% chance.
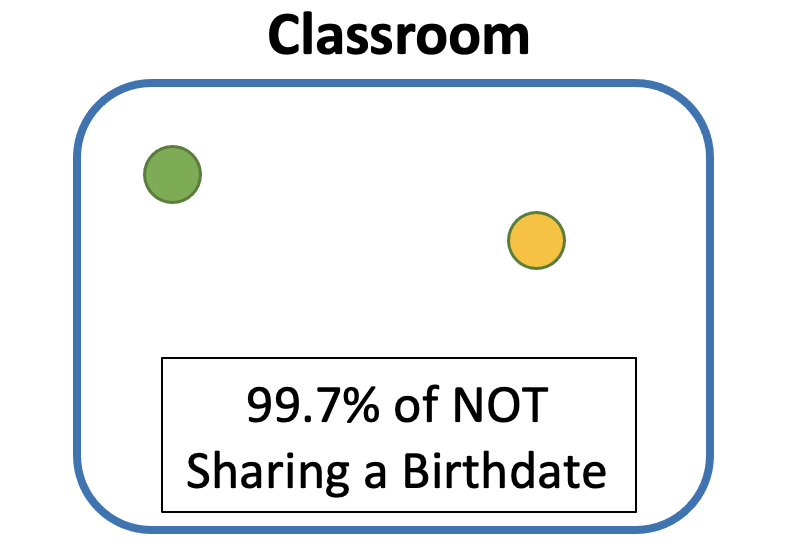
The puzzle will start to grow as the next student enters the room. We are now going to try to calculate the chance that the next person WILL NOT have the same birthday; the way to do that will be in two steps.
First, take the birthday of student 1 out from our pool of options. This will leave us with 364 possible ways to NOT share the same day as student 1. (364/365)
Next, multiply the probability of students 2 NOT sharing a birthday with the other student with the probability that student 1 didn’t share a birthday with anyone when they were the only one if the classroom. (I know that was extremely wordy, so hopefully the following clip helps you visualize what was just written.)
\[ \frac{365}{365} *\frac{364}{365} = 99.7\text% \]
What we learn from the previous step, is that there is a 99.7% chance that the two people will not share the same birthday.
From this point, the previous steps are applied for as many people present to calculate the probability of Not Sharing a Birthday. To find the probability of Sharing the same birthday will require one simple step.
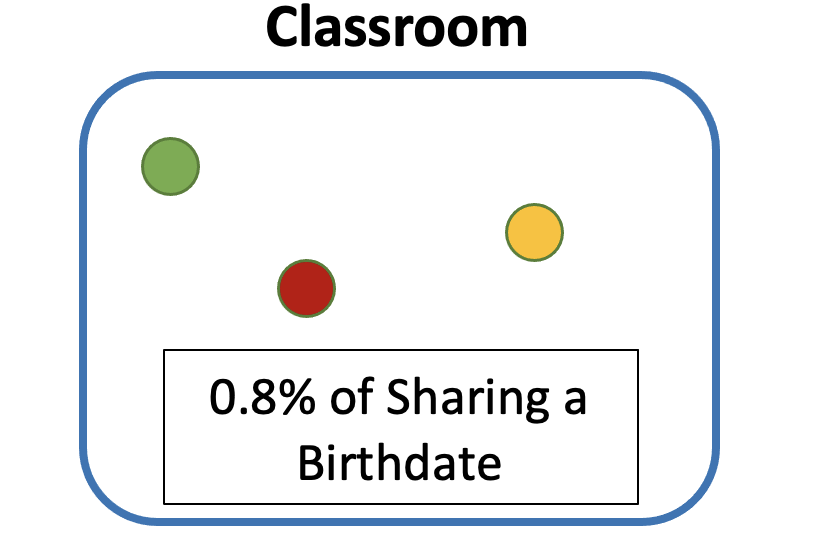
Using the classroom example above, let’s say that a third student enters the room. To find out what the probability that two of the three students will share a birthday, the following will be done:
\[ 1- \frac{365}{365} *\frac{364}{365} *\frac{363}{365}= 0.80\text% \]
Conclusion
As more students enter the classroom, the probability of sharing a birthday will increase drastically! For many people, the Birthday Paradox seems very illogical - especially when you find out that with 23 people in a room, there is a 50% chance that two people will share the same birthday. But once the pattern and explanation is given, the problem seems to make more sense.
The Code
The plot below helps us visualize how the probability of sharing a birthday changes according to the group size (number of people). The code to creating this plot will be placed below. It is fascinating to see how the percentages change.
** Appendix**
library(tidyverse)
library(plotly)
library(ggplot2)

x_range = seq(1:71)
inputs = (0:71)

ratio = 0
answer = 0

for (i in inputs) {
  ratio[i + 1] = (365 - i)/365
}

for (i in inputs) {
  answer[i] = prod(ratio[1:i])
}

final = 1 - answer
df = data.frame(x_range, final)

graph = ggplot(data = df,
               aes(x = x_range, y = final, group = 1 ,
                   text = paste("Number of People: ", x_range, "\n",
                "Probability: ",round((final * 100),1), "%"))) +
  geom_line(aes(x = x_range, y = final), colour = "blue") +
  geom_hline(yintercept = .501, linetype = "dashed", color = "red") +
  labs(title = "What are the Chances of a Shared Birthday?",
       y = "Probability",
       x = "Number of People") +
  theme_bw() +
  scale_y_continuous(labels = scales::percent) +
  theme(plot.title = element_text(hjust = 0.5)) +
  scale_x_continuous(breaks = scales::breaks_width(10))